Zillow average home value
Useful for tracking a broad direction across ZIP 84648. It is not a completed transaction, seller's net, tax value, appraisal, or guaranteed sale price.

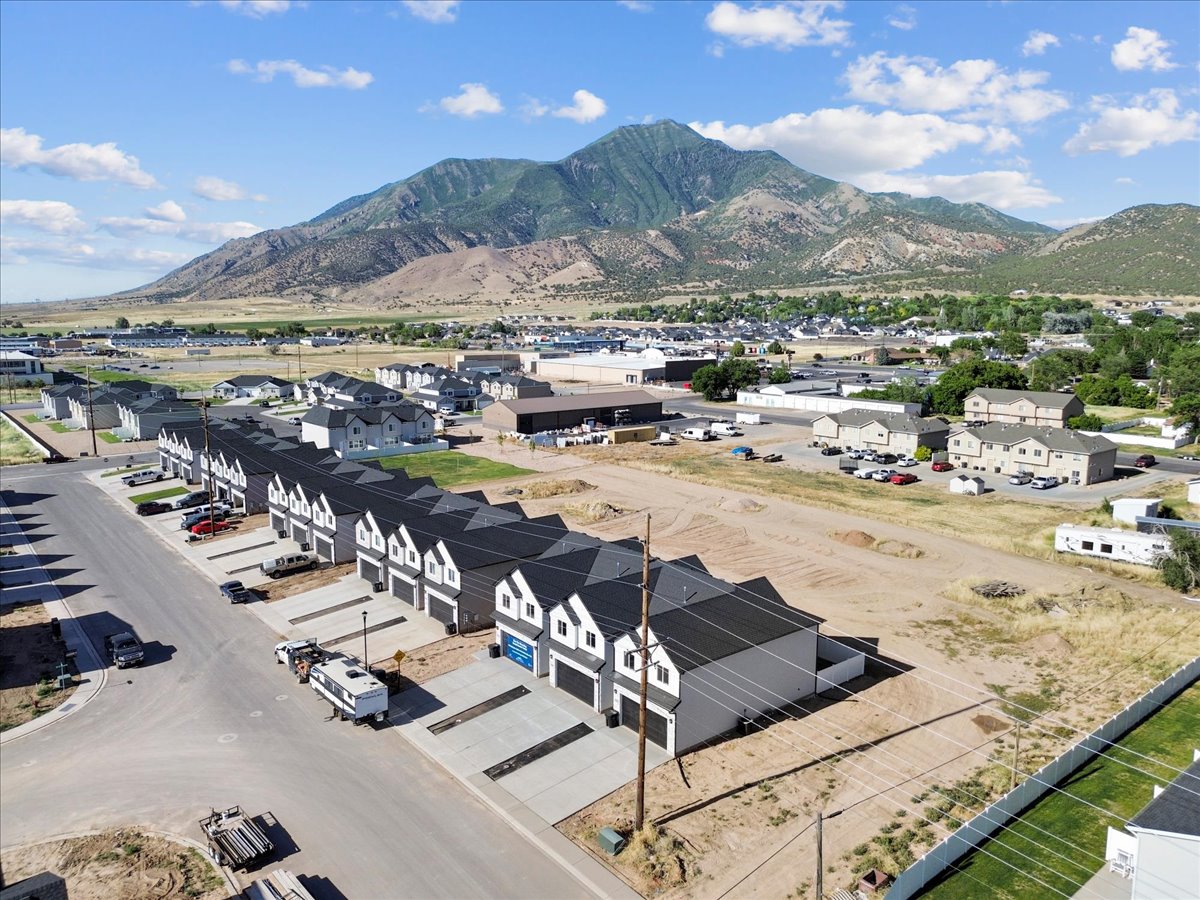
The Nephi market is active but selective. Broad values and closed-sale prices remain higher than one year ago, transaction volume has increased, and some homes still sell above asking. At the same time, more than one-third of listings in Redfin's current dataset show price reductions. This is not a market where every seller wins automatically or every buyer controls the transaction.
Zillow's modeled 84648 value rose 3.3% year over year, while Redfin's recent median closed-sale price rose 5.3%. Redfin also reported a 99.5% sale-to-list ratio and 30.6% of homes selling above list.
However, 36% of listings had price drops. The evidence supports a market with real demand and real price resistance—not a universal buyer's market or seller's market.
Seven useful indicators, each answering a different question.
| Market measure | Current figure | Source and period | What it means |
|---|---|---|---|
| Average home value | $456,466; +3.3% YoY | Zillow, ZIP 84648, June 30, 2026 | A modeled typical-value measure across the ZIP, not a closed-sale median or appraisal |
| Median sale price | $459,775; +5.3% YoY | Redfin, Nephi, three months ending May 2026 | The midpoint of recent closed sales in Redfin's dataset |
| Median list price | $518,283 | Zillow, ZIP 84648, June 30, 2026 | The midpoint of active asking prices; it can reflect a higher-end or acreage-heavy listing mix |
| For-sale inventory | 40 homes | Zillow, ZIP 84648, June 30, 2026 | A broad measure of buyer choice; current MLS inventory will change continuously |
| New listings | 11 | Zillow, ZIP 84648, June 30, 2026 | Recent supply entering the market, not necessarily net inventory growth |
| Market time | 48 days | Redfin, Nephi, three months ending May 2026 | A broad pace indicator; individual listings can move much faster or remain much longer |
| Homes sold | 37 in May | Redfin, Nephi, May 2026 | A transaction-volume snapshot; Redfin reports 17 in the comparable prior-year month |
| Sale-to-list ratio | 99.5% | Redfin current three-month dataset | Average relationship between final sale and last list price—not original list price |
| Sold above list | 30.6% | Redfin current three-month dataset | Some homes still attract enough demand to exceed the listed price |
| Listings with price drops | 36.0% | Redfin current three-month dataset | A meaningful share of sellers adjusted after testing the market |
| Zillow one-year forecast | +0.7% | Zillow, June 30, 2026 | A model-based projection, not a guaranteed outcome for the market or a property |
A useful market report explains what each number is—and what it is not.
Useful for tracking a broad direction across ZIP 84648. It is not a completed transaction, seller's net, tax value, appraisal, or guaranteed sale price.
Useful for understanding the midpoint of recent closed sales. It can shift when the mix of townhouses, acreage, entry-level, or larger homes changes.
Useful for understanding active asking positions. It does not reveal accepted offers, seller concessions, inspection credits, or future closing prices.
Useful for tracking available choice and new competition. A property can enter, go pending, return, expire, sell, or change price between updates.
Useful for planning patience and carrying cost. It should be segmented by home type, price, condition, and neighborhood before applying it to one listing.
Useful for seeing both demand and resistance. One number can show strong closings while another shows sellers reducing before reaching the right market position.
A handful of different transactions can change Nephi's monthly headline more than they would change a large metro.
Nephi has a varied but relatively small inventory base. One month may contain more acreage, large custom homes, or newer construction. Another may contain more townhouses or modest established homes. The median can move even when the value of an unchanged individual home has not moved by the same percentage.
| Mix change | Possible effect on the headline | Better analysis |
|---|---|---|
| More acreage or large homes close | Median sale price can rise even without equal appreciation across ordinary homes | Separate acreage, lot size, square footage, condition, and location |
| More townhouses or entry-level homes close | Median can decline even when like-for-like values remain stable | Compare the same property type and size range |
| New construction enters inventory | List price can rise because new homes may carry size or condition premiums | Separate new from resale and account for incentives or concessions |
| One large project closes multiple units | Volume and price mix can be influenced by one community | Review project-level and non-project transactions separately |
| Few closings occur | One unusual transaction has more statistical influence | Use rolling periods and several sources rather than one month alone |
The current indicators show both buyer activity and seller accountability.
Redfin reported 37 homes sold in May, compared with 17 one year earlier, and 30.6% of homes selling above list in the current dataset. Certain properties still generate strong interest.
37 May sales 30.6% above listRedfin reported price drops on 36% of listings and 48 days on market. Buyers are not accepting every initial price, and sellers may need to adjust when condition, presentation, or value is weak.
36% price drops 48 daysBuyers have time to compare, but strong properties can still attract competition.
A generic preapproval does not include exact taxes, insurance, HOA, mortgage insurance, condition, concessions, or appraisal treatment.
High asking prices do not establish value. Use relevant closed sales and make adjustments for type, age, size, lot, condition, garage, and location.
Inspect structure, systems, drainage, title, permits, HOA, insurance, boundaries, utilities, and the exact condition before the deadlines expire.
A strong property may justify a fast decision. Do not waive important protection simply because 30.6% of current sales exceeded list.
A reduction may create value—or reveal that the original position was unrealistic. Reanalyze the current price and property rather than focusing on the size of the drop.
Include loan, taxes, insurance, HOA, utilities, immediate work, maintenance, reserves, commute, and future selling exposure.
Use the Complete Nephi Buyer Guide for neighborhoods, housing types, schools, commute, due diligence, and the purchasing process. Use the Priority Homes Buyer Roadmap for the published Loveless Estates purchase path.
Demand exists, but the market is measuring value more carefully than a frenzy market would.
| Seller decision | Better practice | Common mistake |
|---|---|---|
| Pricing | Use recent relevant closed, pending, active, expired, and withdrawn evidence with property adjustments | Choosing the highest active list price as proof of value |
| Preparation | Address safety, water, odor, cleanliness, light, landscaping, clutter, and obvious deferred maintenance | Assuming buyers will ignore visible work because inventory is limited |
| Square footage | Label finished, unfinished, basement, garage, lot, and measurement source clearly | Comparing total square footage with another home's finished area |
| Photography and copy | Show the actual property accurately and explain utility, condition, improvements, and location | Using outdated, misleading, dark, or incomplete media |
| Showing access | Create reasonable access while protecting occupants and property | Making serious buyers wait too long or providing unclear instructions |
| Feedback | Track repeated objections to price, condition, layout, smell, maintenance, access, or financing | Dismissing consistent market feedback as buyer error |
| Price changes | Reposition early enough to reach active buyers when the evidence supports it | Making small repeated reductions that fail to change the buyer search range |
| Offer analysis | Compare net, financing, appraisal, contingencies, timing, concessions, repairs, and certainty | Selecting only the highest headline price |
Kerry can review the exact home, condition, finished area, lot, garage, HOA, location, improvements, competing inventory, and recent comparable sales before recommending a launch or adjustment strategy.
Call Kerry: (435) 660-0264 Meet the Local TeamTownhouses, detached homes, acreage, apartments, new construction, and investment properties solve different problems.
Compare finished space, basement potential, garage, yard, HOA responsibilities, sound, stairs, parking, incentives, and current competing units.
See Nephi townhouses →Compare age, effective condition, roof, HVAC, foundation, drainage, sewer, updates, basement, outbuildings, lot, water, and any HOA.
Compare housing types →Access, boundaries, water rights, wells, septic, irrigation, zoning, animals, outbuildings, soils, utilities, fire access, and financing can dominate value.
Current Priority Homes published rent ranges from $1,300 to $2,200 across Ray's and Loveless, subject to actual vacancy and lease terms.
Compare local apartments →Underwrite actual rent, vacancy, HOA, taxes, insurance, repairs, reserves, management, financing, legal use, and exit costs.
Open the investor guide →Lot, utilities, soils, grading, plans, permits, financing, site work, allowances, changes, schedule, and exterior completion determine total cost.
Explore custom homes →A current product example can help buyers compare utility, but one listing is not the market.
The current featured Loveless Estates home at 233 W 815 N #53 was shown at $389,900 on July 17, 2026. It reports three bedrooms and 2,579 total square feet, with finished and unfinished categories that must be verified. The listing is below the broad Zillow value and Redfin sale-price figures, but that alone does not prove a discount.
| Loveless comparison factor | Current example | Required market adjustment |
|---|---|---|
| Price | $389,900 current featured listing | Compare with relevant townhouse sales, concessions, incentives, HOA, and current competing units |
| Total square footage | 2,579 reported | Separate finished and unfinished space before calculating value per square foot |
| Condition | New construction, built 2026 | Account for warranty, punch list, landscaping, completion, and new-construction premium |
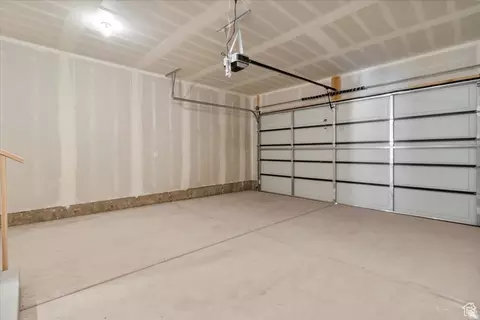
| Garage and yard | Attached garage and fenced-yard description | Compare exact dimensions, ownership, HOA rules, maintenance, and competing property utility |
| HOA | Portal-listed $90/month; verify | Review dues, coverage, budget, reserves, insurance, maintenance, rentals, and assessments |
| Property type | Attached townhouse in a 75-unit community | Do not compare directly with detached homes or acreage without adjustment |
Market appreciation can support a strategy, but it cannot replace property-level cash-flow analysis.
| Investor input | What the market report contributes | What still requires property evidence |
|---|---|---|
| Acquisition | Broad value, sale-price, inventory, and negotiation context | Contract price, closing costs, repairs, financing, concessions, and complete basis |
| Rent | Local housing demand and available rental product context | Executed leases and adjusted rent comps for the same bedrooms, garage, yard, size, condition, and location |
| Vacancy | General market activity | Property type, tenant pool, pricing, season, management, turnover, and current competing rentals |
| Expenses | No direct answer | Taxes, insurance, HOA, utilities, maintenance, capital reserves, management, leasing, legal, and accounting |
| Financing | Marketability context | Rate, term, points, DSCR, reserves, occupancy, appraisal, HOA, title, and lender conditions |
| Appreciation | Recent broad measures were positive | Downside, flat, and upside scenarios; no future gain should be guaranteed |
| Exit | Current transaction pace and negotiation context | Likely buyer, selling costs, condition, loan balance, tax, timing, and future competition |
The Priority Homes Investment Properties guide provides the full acquisition, NOI, cap-rate, cash-flow, cash-on-cash, DSCR, HOA, management, financing, and exit framework.
Price and square footage must be weighed against time, services, routine, and preferred community scale.
Nephi can appeal to buyers seeking a smaller-community setting, newer or larger housing options, easier local parking, and access to central Utah recreation. A household tied to Utah County every weekday should measure the actual commute rather than relying on a broad mileage or drive-time claim.
Test departure and return times, destination, construction, winter conditions, fuel, vehicle wear, and whether remote or hybrid work changes the calculation.
Check groceries, healthcare, schools, childcare, worship, recreation, restaurants, deliveries, internet, and services the household uses repeatedly.
Finished space, garage, yard, lot, condition, HOA, storage, repairs, payment, and ownership period can matter more than the citywide midpoint.
Use the Living in Nephi Guide for a full relocation evaluation and the Nephi Schools Guide for current school-research questions.
Move from broad context to a property-specific decision without overrelying on one statistic.
Townhouse, detached, acreage, new construction, custom home, rental, or investment property.
Use current active, pending, and sold data while retaining dates and enough history to avoid a one-month distortion.
Match location, type, finished area, age, lot, garage, condition, basement, HOA, and transaction date.
Identify repairs, upgrades, function, title, permits, insurance, HOA, financing, and issues broad data cannot reveal.
Include price, loan, taxes, insurance, HOA, utilities, immediate work, reserves, commute, transaction cost, and timeline.
Refresh listings, comparable sales, lender terms, insurance, HOA, and property status immediately before the decision.
Bring the address, housing goal, price range, move date, financing status, property type, and questions. Kerry can connect the broad market evidence to current Nephi listings and relevant comparable sales.
Call Kerry: (435) 660-0264 Request Local GuidanceCurrent answers with source, period, definition, and caution retained.
Zillow reported $456,466 for ZIP code 84648 through June 30, 2026, up 3.3% over one year. It is a modeled value index—not a specific home's appraisal or a closed-sale median.
Redfin reported $459,775 over the three months ending May 2026, up 5.3% year over year. The sold-property mix can influence the median in a smaller market.
Zillow reported 40 homes in ZIP 84648 inventory on June 30, 2026 and 11 new listings in its current period. Inventory changes continuously.
Redfin reported 48 days on market for the three months ending May 2026. A home's price, type, condition, location, presentation, financing, and seller response can create a very different result.
The evidence is mixed. Values, sale prices, and volume were positive year over year, but 36% of listings had price drops. Strong homes can attract competition; weakly positioned listings can require time and adjustment.
The latest broad year-over-year measures were positive: +3.3% for Zillow's average 84648 value and +5.3% for Redfin's Nephi median sale price. Individual properties and future periods can move differently.
Active listings may include larger, newer, acreage, or higher-end homes. Asking prices are not completed sale prices. Review the active mix before treating the number as a target for a specific home.
The current $389,900 featured listing is below broad mid-$400,000s market measures, but property type, finished space, unfinished basement, HOA, concessions, lot, condition, and comparable townhouse sales must be considered before describing it as a discount.
It may fit some strategies, but the property must work under conservative rent, vacancy, expense, financing, management, reserve, and exit assumptions. Recent appreciation does not guarantee future return.
Call Kerry Anderson at (435) 660-0264 for property-specific Nephi comparable sales, inventory, tours, buyer guidance, or seller strategy. Call Priority Homes at (435) 623-0897 for builder questions.
Kerry Anderson — Equity Real Estate: property-specific Nephi pricing, inventory, comparison tours, buyer representation, seller preparation, offers, and contracts. (435) 660-0264.
Priority Homes Office: Loveless Estates, construction, community information, and builder questions. (435) 623-0897.
Priority Homes is located at 1451 South Main Street, Nephi, Utah 84648. Published office hours are Monday through Friday, 8 AM to 5 PM.
The broad report establishes context. The decision still requires current inventory, relevant comparable sales, complete ownership costs, inspection, title, insurance, financing, HOA review, and the household's actual timeline.
Call Kerry: (435) 660-0264 Request a Nephi Consultation