2021–2025 Price Index · Current 2026 Values · Sale Prices · Asking Prices · Buyer and Seller Strategy
Nephi Home Prices: What the Five-Year Trend Really Shows
Juab County's house-price index rose 29.3% from 2021 through 2025—but the headline hides two very different markets. Almost all of the surge arrived in 2021–2022. Growth then slowed to a measured pace. Current Nephi prices remain positive year over year, yet buyers are comparing value, condition, space, payment, and long-term fit more carefully.
By The Priority Homes Team · Kerry Anderson, Equity Real Estate · Local Nephi pricing guidance
Rebuilt July 17, 2026 · FRED annual trend through 2025 · Current market through May–June 2026 · ~16 min read
Measurement standard: this page's five-year chart is the FHFA/FRED Juab County House Price Index—not a table of Nephi median sale prices. Current dollar measures come from Zillow and Redfin and retain their separate geography, period, and definition. A property-specific value still requires relevant comparable sales and condition adjustments.
The five-year verdict
Nephi-area values reset sharply higher in 2021–2022, then entered a slower, more selective growth phase.
The Juab County index increased 23.97% in a single year from 2021 to 2022. The next three annual increases were approximately 1.71%, 0.83%, and 1.74%.
The cumulative five-year figure is important, but the current lesson is different from 2021: buyers do not need to assume that every home will immediately outrun careful evaluation. Price, payment, finished space, condition, property type, HOA, garage, yard, commute, and ownership period matter.
First, separate index, value, sale price, and list price
The page title uses a familiar search phrase, but the data must retain their actual definitions.
Measure
Current use on this page
What it answers
What it does not answer
FHFA/FRED House Price Index
Juab County annual trend, 2021–2025
How covered house prices changed over time relative to an index base
The dollar median price of Nephi homes or the value of one property
Zillow Home Value Index
$456,466 for ZIP 84648 through June 30, 2026
A modeled typical value across a broad geography and housing mix
A completed sale, appraisal, seller net, or guaranteed price
Redfin median sale price
$459,775 for Nephi, three months ending May 2026
The midpoint of homes sold in the current transaction dataset
Like-for-like appreciation of every existing home
Zillow median list price
$518,283 for ZIP 84648 on June 30, 2026
The midpoint of active asking prices
What buyers accepted, concessions, inspection credits, or future closings
Property-specific market value
Not supplied by a citywide page
What an informed buyer may pay for one property at a point in time
A number that can be obtained by applying a broad median without adjustment
Do not rename the FHFA index as a dollar median-price series.
The index is the strongest consistent five-year directional measure used here. The current dollar figures are separate measures from Zillow and Redfin.
Juab County House Price Index: 2021–2025
The latest displayed annual FHFA/FRED observation is 2025.
FHFA/FRED Juab County All-Transactions House Price Index
Annual · Not seasonally adjusted · Index 2000 = 100 · Bar lengths shown relative to the 2025 observation
2021
233.67
2022
289.67
2023
294.63
2024
297.08
2025
302.25
Lower index2025 = full bar
Year
Index
Annual change
Interpretation
2021
233.67
Starting point
The baseline for this five-observation comparison
2022
289.67
+23.97%
The defining upward reset within the five-year period
2023
294.63
+1.71%
Growth continued but slowed dramatically
2024
297.08
+0.83%
Near-flat annual movement compared with the earlier surge
2025
302.25
+1.74%
Positive but measured growth
2021–2025
233.67 → 302.25
+29.35% cumulative
Approximately 6.65% compound annual growth across four annual intervals
FHFA describes annual county indexes as developmental.
The values may be revised as new data and technical adjustments are incorporated. The index uses appraisal values and sales prices associated with mortgages bought or guaranteed by Fannie Mae and Freddie Mac; it does not include every transaction or property type equally.
The trend has two different market phases
A cumulative five-year percentage should not make the recent market look faster than it is.
Phase 1 · 2021–2022
Rapid price reset
The county index increased almost 24% in one year. Buyers operating in that environment faced fast-moving affordability pressure and had reason to fear that waiting could materially change the price level.
+23.97%Largest annual jump
Phase 2 · 2022–2025
Slower positive movement
The index rose only about 4.34% from 289.67 in 2022 to 302.25 in 2025. Buyers regained more room to evaluate payment, property quality, and alternatives, while sellers needed to justify value.
Measured paceMore selective buyers
What changed for decision-making
Question
Rapid-growth environment
Measured-growth environment
Buyer urgency
Price acceleration can punish delay
The buyer can compare more carefully, but desirable homes can still move quickly
Seller pricing
Rising demand may forgive an aggressive launch
Overpricing can lose early attention and produce reductions
Property quality
Inventory pressure can obscure some weaknesses
Condition, utility, finished space, photos, and repair exposure receive more scrutiny
Appreciation assumptions
Recent growth may feel repeatable even when it is not
Historical gains should be separated from a conservative future scenario
Negotiation
Competition may dominate
Property-specific demand, market time, price history, and seller priorities matter more
The market did not reverse after 2022; it changed speed.
The annual county index remained positive through 2025. The proper conclusion is slower growth—not automatic price decline or renewed rapid appreciation.
The current 2026 Nephi price snapshot
The five-year county direction and current city or ZIP dollar measures tell different parts of the story.
Current measure
Figure
Period and geography
Best use
Zillow average home value
$456,466; +3.3% YoY
ZIP 84648, June 30, 2026
Broad current value level and year-over-year modeled direction
Redfin median sale price
$459,775; +5.3% YoY
Nephi, three months ending May 2026
Recent midpoint of closed transactions
Redfin median sale price per ft²
$166; -19.6% YoY
Nephi, current Redfin dataset
Transaction-mix context; never apply without finished-area and property adjustments
Zillow median list price
$518,283
ZIP 84648, June 30, 2026
Current active seller asking-position context
Zillow inventory
40 homes
ZIP 84648, June 30, 2026
Broad measure of current buyer choice
Redfin days on market
48 days
Nephi, three months ending May 2026
Broad pace—not a prediction for an individual listing
Zillow one-year forecast
+0.7%
ZIP 84648, June 30, 2026
Model-based scenario context, not a guarantee
The -19.6% price-per-square-foot change does not prove that like-for-like homes lost 19.6%.
Square-foot metrics are especially sensitive to the mix of homes sold, finished-area reporting, property type, acreage, new construction, and large versus small homes.
The rebuilt Nephi Real Estate Market Report adds inventory, transaction volume, market time, sale-to-list performance, price reductions, and property-segment guidance to this historical trend.
Why the current asking price is $58,508 above the recent median sale price
The gap is worth studying, but it should not be interpreted as a forecast.
Zillow's $518,283 median list price is $58,508 above Redfin's $459,775 recent median sale price. Several explanations can exist at the same time:
Different geography
Zillow reports ZIP 84648; Redfin reports its Nephi city dataset. The ZIP can include a different property mix.
Different property mix
Active listings may contain more acreage, larger homes, new construction, or high-priced inventory than the homes that recently closed.
Asking is not selling
A list price can later reduce, expire, withdraw, accept concessions, or close below the initial or final asking amount.
Timing difference
The list measure is dated June 30; the Redfin sale measure uses closings through May. Market composition can change between periods.
Condition and size
Larger, newer, remodeled, finished-basement, garage, and lot attributes can shift the active median upward.
Seller expectations
Some sellers may be testing the market above where recent buyers have demonstrated demand.
Do not use $518,283 as the starting value for an ordinary Nephi home.
Build a relevant comparable-sales set for the actual property, then use active and pending listings as competition and market-position evidence.
Higher prices make payment and usable value more important
A buyer lives with the complete monthly cost and the property's daily function—not the five-year index.
Price growth affects affordability, but the purchase decision also depends on interest rate, down payment, mortgage insurance, taxes, owner insurance, HOA, utilities, repairs, reserves, closing costs, and expected ownership period. A lower price can still deliver poor value when the home needs major work or does not fit the household. A higher price can sometimes be justified by finished space, useful layout, garage, yard, condition, location, and reduced immediate work.
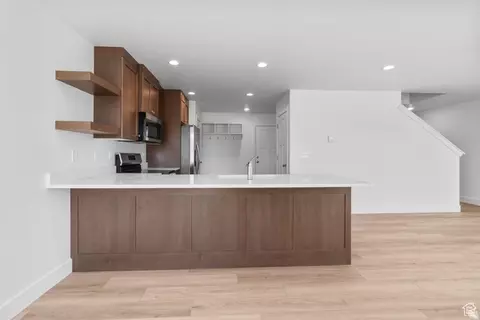
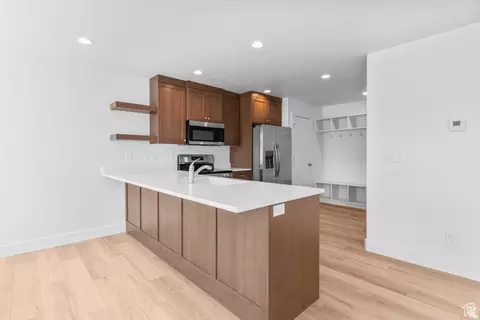
Livability is part of value. This Loveless Estates kitchen illustrates why buyers compare layout, storage, appliances, finishes, circulation, and move-in condition. The image does not establish market value, appraisal, appreciation, or the condition of another unit.
Affordability input
Your amount
Evidence to obtain
Purchase price
$________
Contract and property-specific comparative market analysis
Down payment and closing cash
$________
Written lender and settlement estimates
Principal and interest
$________
Rate, term, points, lock, loan amount, and mortgage structure
Taxes, insurance, HOA, and mortgage insurance
$________
Tax record, insurer quote, HOA documents, and lender estimate
Utilities and commute
$________
Property systems, household usage, route, schedule, and vehicle cost
Immediate work
$________
Inspection, specialist review, bids, selections, and move-in requirements
Monthly maintenance and capital reserve
$________
Age, condition, warranties, HOA boundaries, and systems
Complete monthly housing cost
$________
Compare with net income, debt, emergency fund, and savings goals
Historical appreciation does not reduce today's payment.
Treat future value as a scenario. The buyer must be able to afford the property without relying on a quick sale, refinance, tax benefit, or continued 6.65% annual appreciation.
What the five-year trend means for buyers
The current environment supports disciplined comparison—not paralysis and not panic.
Use current comparables
The 29.3% historical index increase does not establish today's offer. Compare recent sales of the same property type, size, age, condition, lot, garage, and location.
Model three timelines
Run an earlier-than-planned sale, expected hold, and longer hold with realistic selling costs, maintenance, and value ranges.
Protect cash reserves
Do not use all available cash for the down payment. Preserve funds for emergencies, deductibles, repairs, moving, and ownership surprises.
Compare finished space
Separate finished and unfinished square footage before using total area or price per square foot.
Do not time one forecast
Zillow's +0.7% one-year forecast may change and cannot predict the selected property. Buy when the home and finances fit.
Inspect the value story
Garage, storage, yard, condition, commute, HOA, repairs, accessibility, and daily layout can matter more than the citywide midpoint.
“Prices rose 29%” is not a reason to waive diligence.
A buyer should still protect inspection, title, insurance, financing, appraisal, HOA, boundary, permit, and property-condition review according to the contract and professional advice.
The Complete Nephi Buyer Guide connects pricing to neighborhoods, property types, schools, commute, financing, inspection, title, and the purchasing process.
What the price trend means for sellers
Long-term appreciation can create equity, but buyers still measure the current offering against current alternatives.
Seller question
Better answer
Risky assumption
What is my home worth?
Use property-specific recent sales, current competition, condition, size, lot, garage, updates, and location
Apply 29.3% to an old purchase price and call the result market value
Should I price from the active median?
Use active listings to understand competition after closed-sale analysis
Treat $518,283 as the default value of every Nephi home
Wait until the listing becomes stale before responding to consistent evidence
Which offer is best?
Compare net proceeds, financing, appraisal, contingencies, repairs, timing, concessions, and certainty
Select only the highest headline amount
Past growth is not a substitute for current presentation.
In a slower-growth market, buyers see more clearly whether a home is clean, maintained, accurately measured, well photographed, properly priced, and easy to evaluate.
Turn the historical trend into a current pricing analysis
Kerry can review the actual home, finished space, lot, garage, condition, improvements, HOA, relevant closed sales, active competition, and likely buyer segment before recommending a listing or offer strategy.
Access, boundaries, water rights, wells, septic, irrigation, zoning, animals, utilities, soils, outbuildings, and financing require specialized adjustment.
New construction
Price the completed product
Plan, lot, site work, allowances, included features, upgrades, landscaping, incentives, warranty, completion, and builder concessions must be separated.
Investment property
Income before appreciation
Use actual rent, vacancy, expenses, management, reserves, HOA, financing, legal use, and exit cost. Historical price growth cannot repair negative cash flow.
Where Loveless Estates fits in the price conversation
A current townhouse example below broad market midpoints can be compelling—but only after an adjusted comparison.
The current featured Loveless Estates listing at 233 W 815 N #53 was shown at $389,900 on July 17, 2026. It reports three bedrooms and 2,579 total square feet. Priority Homes commonly describes approximately 1,800 finished square feet plus basement potential, which must be verified for the exact unit.
Comparison
Current figure
What must be adjusted
Loveless featured price
$389,900
Unit status, concessions, incentives, HOA, finish level, completion, and relevant townhouse sales
Zillow average value
$456,466
Modeled ZIP-wide value across different property types and locations
Redfin median sale price
$459,775
Recent all-home transaction mix, not a townhouse-only comparable set
Zillow median list price
$518,283
Current active asking mix that may include acreage, larger, or higher-end homes
Loveless total area
2,579 ft² reported
Finished versus unfinished area, measurement source, basement completion, and utility
One current product example—not market-wide proof. The kitchen illustrates finishes and practical layout buyers may value at Loveless Estates. Price positioning still requires current unit details, adjusted townhouse comparable sales, HOA review, finished-space verification, financing, and inspection.
Below the median does not automatically mean undervalued.
A townhouse and a detached all-home median are not direct substitutes. The stronger value case comes from comparing Loveless with relevant attached-home alternatives by finished space, garage, yard, age, condition, HOA, location, payment, and daily function.
Use the Loveless Estates Community Guide for the current unit, space definitions, HOA, finishes, amenities, yard, garage, buyer process, and verification checklist.
What five-year price growth means for investors
Historical appreciation can support an exit scenario, but current income and risk determine whether the property is investable.
Investor question
What the five-year trend contributes
What still requires underwriting
Market direction
County index increased materially over five observations
Downside, flat, and modest-growth future scenarios
Entry price
Broad context for the current price level
Contract, closing, repairs, incentives, financing, and complete acquisition basis
Rent
No direct answer
Executed leases and adjusted rental comps for bedrooms, size, garage, yard, condition, and location
Cash flow
No direct answer
Vacancy, taxes, insurance, HOA, utilities, maintenance, reserves, management, and debt service
Resale
Evidence that the broad price level reset higher
Future buyer pool, condition, project health, selling costs, market time, and remaining loan
Risk
Recent growth has slowed materially
Rate, vacancy, repair, assessment, insurance, liquidity, concentration, and tenant risks
Do not project the 6.65% historical CAGR into every future pro forma.
Most of the cumulative growth resulted from one exceptional annual jump. Use conservative appreciation scenarios and require the property to work without an aggressive resale assumption.
The Priority Homes Investment Properties guide covers NOI, cap rate, cash flow, cash-on-cash return, DSCR, management, reserves, HOA restrictions, financing, and exit analysis.
What to watch for the next price update
The historical trend changes slowly; current market evidence can change every week.
Watch 1
FHFA annual revision
Review the next Juab County annual observation and any revisions to the 2021–2025 index history.
Watch 2
Current sale-price mix
Track whether the Redfin median changes because of like-for-like value movement or a different mix of homes sold.
Watch 3
List-to-sale gap
Observe whether high active asking prices convert into closings, reduce, expire, or remain on market.
Watch 4
Inventory and market time
More choices and longer exposure can shift leverage toward buyers; scarce best-fit homes can remain competitive.
Watch 5
Financing affordability
Rate, mortgage insurance, taxes, insurance, and lender standards can alter buyer purchasing power without a change in price.
Watch 6
New-construction competition
Track pricing, incentives, finishes, completion, inventory, and how new options affect resale demand.
Use the historical page and current report together.
This page explains the five-year direction. The market report should be refreshed more frequently for inventory, market time, current prices, and negotiation evidence. The forecast page should present future scenarios without promises.
Nephi home-price FAQ
Clear answers that preserve the definition and period of every figure.
What is the current median home price in Nephi?
Redfin reported a median closed-sale price of $459,775 for the three months ending May 2026, up 5.3% year over year. The transaction mix can move the median.
What is the current average home value?
Zillow reported $456,466 for ZIP code 84648 through June 30, 2026, up 3.3% over one year. This is a modeled value measure rather than a median sale price or appraisal.
How much did Juab County prices rise from 2021 through 2025?
The FHFA/FRED county index rose from 233.67 to 302.25, a cumulative increase of approximately 29.35% and a four-interval compound annual growth rate of approximately 6.65%.
When did most of the increase occur?
The index rose 23.97% from 2021 to 2022. Annual growth then slowed to approximately 1.71% in 2023, 0.83% in 2024, and 1.74% in 2025.
Is the county index the same as Nephi's median price?
No. The index measures price movement over time for covered transactions and appraisals. The median sale price is the midpoint of recent closed transactions. Both are useful when kept separate.
Why is the median list price higher than the sale price?
Zillow's $518,283 list figure uses active ZIP-wide inventory, while Redfin's $459,775 figure uses recent city-level closings. Geography, period, property mix, seller expectations, and the difference between asking and selling all matter.
Are home prices still rising?
The latest year-over-year Zillow and Redfin measures were positive, but the county's annual growth after 2022 was far slower than the initial surge. No source can guarantee the next period.
Is Loveless Estates priced below the median?
The current featured price of $389,900 is below the broad value and sale-price measures. That does not establish a discount because it is an attached townhouse with specific finished and unfinished space, HOA, condition, and comparable-sale requirements.
Should buyers wait because growth slowed?
Waiting may help or hurt depending on price, rate, inventory, savings, timeline, and the property. Compare a purchase-now scenario with realistic wait scenarios rather than relying on one forecast.
Who can help value a specific property?
Call Kerry Anderson at (435) 660-0264 for current Nephi comparable sales, inventory, tours, and buyer or seller guidance. A lender may require an independent appraisal.
Sources, calculations, image use, and editorial method
FHFA/FRED series: All-Transactions House Price Index for Juab County, Utah, series ATNHPIUS49023A. Annual, not seasonally adjusted, index 2000 = 100. Values: 233.67 in 2021; 289.67 in 2022; 294.63 in 2023; 297.08 in 2024; and 302.25 in 2025. Source: Federal Reserve Bank of St. Louis FRED.
FHFA caution: FRED's notes state that annual county indexes should be considered developmental and may be revised because of new data or technical adjustments. The source uses sales and appraisal data associated with mortgages bought or guaranteed by Fannie Mae and Freddie Mac.
Zillow 84648: $456,466 average value, +3.3% one-year change, $518,283 median list price, 40 listings, 11 new listings, and +0.7% one-year forecast through June 30, 2026. Source: Zillow 84648 Housing Market.
Redfin Nephi: $459,775 median sale price, +5.3% year over year, $166 median price per square foot, -19.6% year over year, 48 days on market, and 37 May closings. Source: Redfin Nephi Housing Market.
Geography: the long-term index is Juab County; Zillow uses ZIP 84648; Redfin uses its Nephi city dataset. The figures cannot be combined as though they describe an identical boundary and housing mix.
Loveless Estates: the current Priority Homes community guide provides the featured $389,900 listing and its property-specific verification requirements.
Images: all three principal images were already on the existing Nephi median-price page. They illustrate one Priority Homes townhouse product and do not prove market-wide price, value, appreciation, appraisal, or resale.
This page is educational and is not an appraisal, comparative market analysis, inspection, title opinion, legal or tax advice, investment recommendation, loan approval, or guarantee of price, appreciation, market time, or sale.
Update policy: review FRED when the annual county observation changes and refresh Zillow and Redfin figures at least monthly. Revise the Loveless example whenever the featured listing changes.
Local Nephi pricing guidance
Current comparable sales · Inventory · Tours · Buyer and seller strategy
Kerry Anderson — Equity Real Estate: property-specific Nephi pricing, current inventory, comparison tours, buyer representation, seller preparation, offers, and contracts. (435) 660-0264.
Priority Homes Office: Loveless Estates, construction, community, and builder questions. (435) 623-0897.
Priority Homes is located at 1451 South Main Street, Nephi, Utah 84648. Published office hours are Monday through Friday, 8 AM to 5 PM.
Use the trend for context—then price the exact home
The five-year index explains how the market reached today's level. A real decision still requires current comparable sales, finished-space verification, condition, property type, financing, insurance, title, HOA, inspection, complete cost, and ownership timeline.